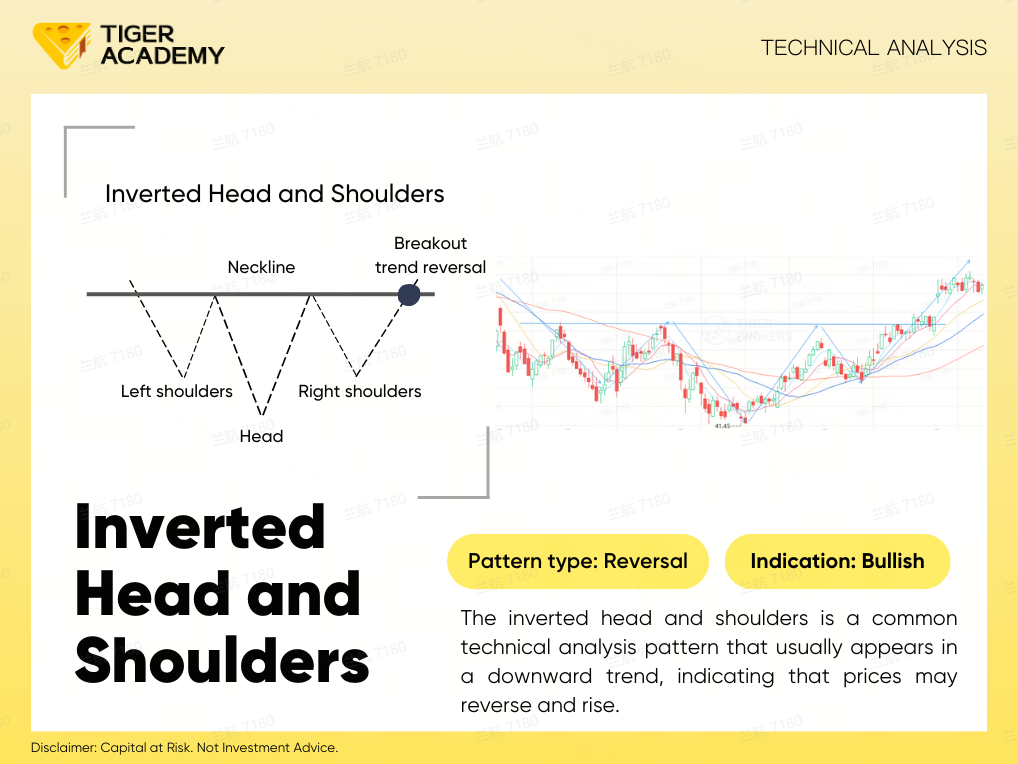
The inverted head and shoulders is a common technical analysis pattern that usually appears in a downward trend, indicating that prices may reverse and rise.
Simply put, from a technical pattern perspective, the inverted head and shoulders chart pattern looks like an inverted head and two shoulders.
The appearance of the inverted head and shoulder pattern indicates that market sentiment may shift from sellers to buyers, and prices may rise.
So, what kind of technical chart pattern can we call the inverted head and shoulders?
In general, this technical pattern has three obvious characteristics:
1. Three valleys:
There will be three valleys on the chart, with the middle valley lower and the valleys on both sides relatively higher. The middle valley is called the head, and the higher valleys on both sides are called the shoulders.
2. Neckline:
The horizontal line connecting the top of the shoulders is called the neckline, which is an important resistance line. When the price breaks through the neckline, it may mean that the trend will change.
3. Volume:
The inverted head and shoulders pattern is usually accompanied by changes in volume. When the head is formed, the volume is usually low, while when the shoulders are formed, the volume is relatively high.
In the inverted head and shoulder pattern, investors usually focus on the breakthrough of the neckline. If the price breaks through the neckline and confirms the upward trend, they may consider buying or taking other appropriate actions.
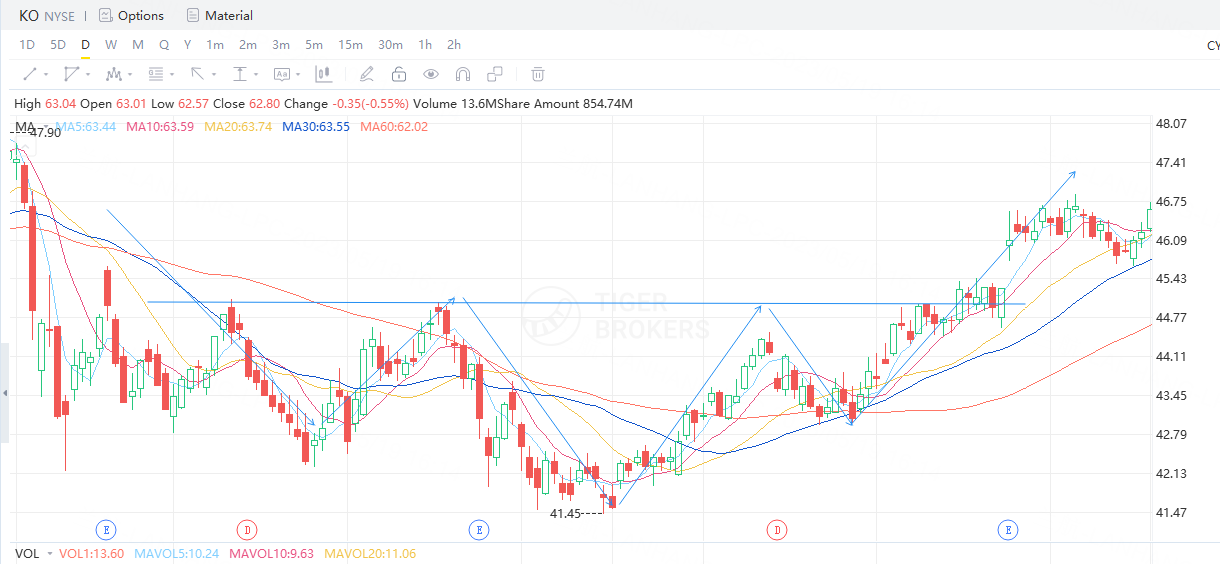
Here's an example to help you better understand the inverted head and shoulders technical pattern:
Between February and August 2018, Coca-Cola formed an inverted head and shoulders technical pattern, indicating that Coca-Cola's bearish forces had weakened and its upward expectations were gradually strengthening.
It should be noted that the inverted head and shoulders pattern is determined based on past data and technical analysis.
The appearance and validity of the pattern may be affected by changes in market conditions and subsequent price movements.
Therefore, you should pay attention to the following points:
1. Confirm the validity of the pattern:
The mere appearance of an inverted head and shoulders pattern is not enough to confirm a price reversal. You should also wait for the price to break through the neckline to confirm the validity of the pattern. Breaking through the neckline may indicate the start of an upward trend.
2. Determine the target price:
The inverted head and shoulders pattern can provide a prediction of price reversal. You can use the height difference of the pattern to determine a target price range. Usually, the target price is between the distance from the height difference of the inverted head and shoulder pattern to the neckline.
3. Pay attention to the time span of the pattern:
The inverted head and shoulder pattern may take some time to form, so investors should pay attention to the time span and cycle of the pattern. Patterns with longer time spans may be more valid.
The inverted head and shoulders pattern can only be used as an auxiliary tool in combination with other analytical methods to make wiser investment decisions.
At the same time, pay attention to the validity of the pattern and the appearance of confirmation signals, and comprehensively consider the market environment and fundamentals, which can improve the accuracy of investment decisions!